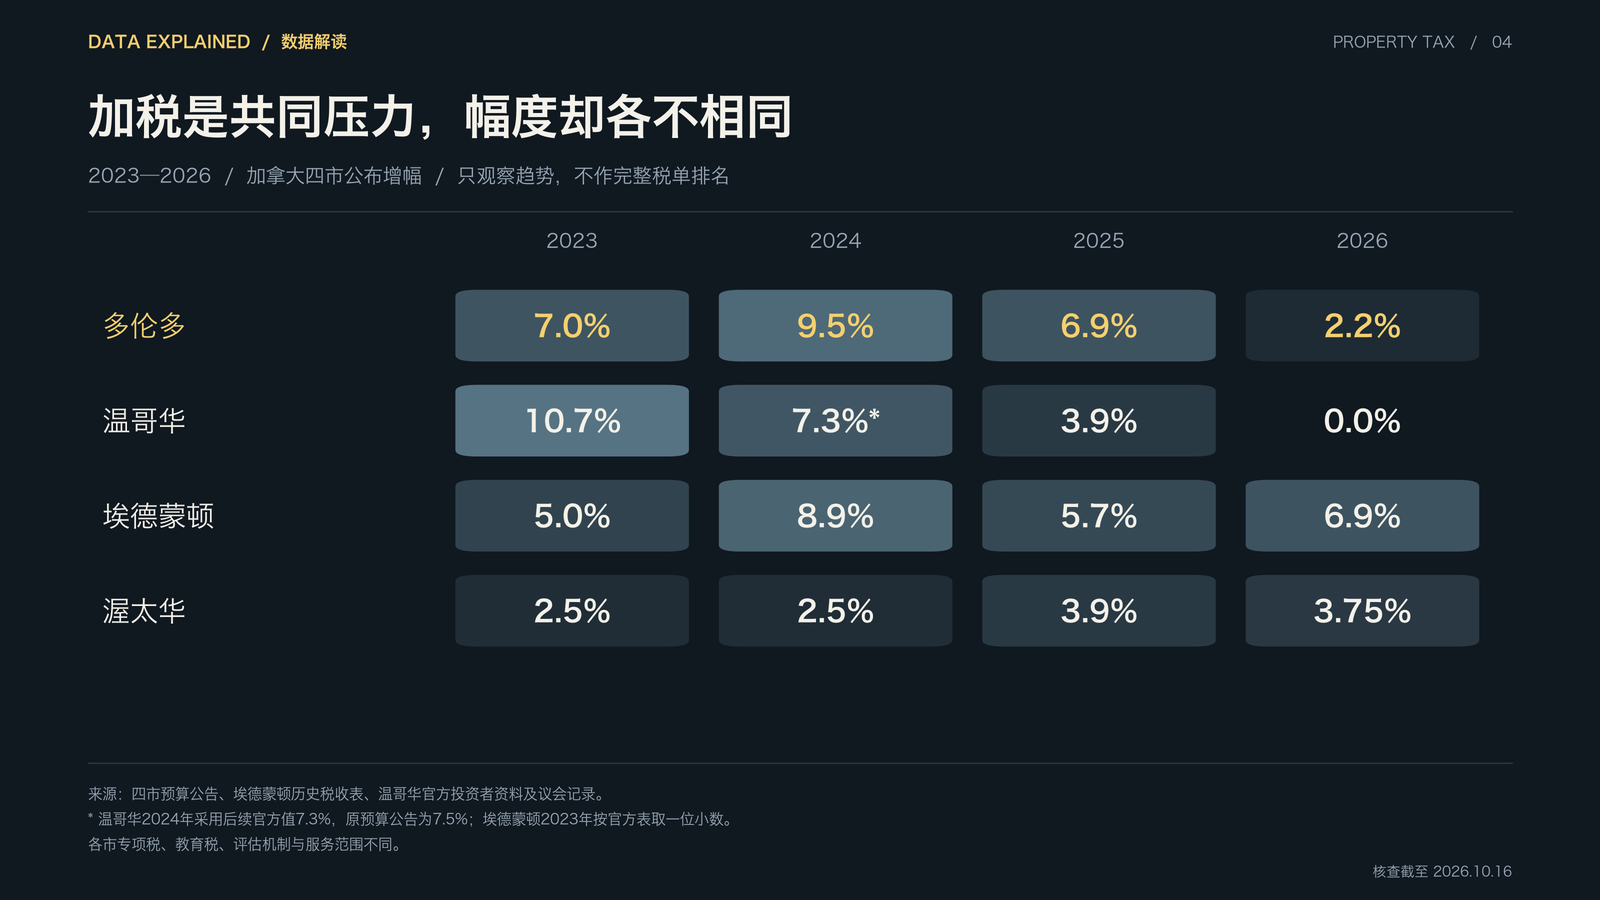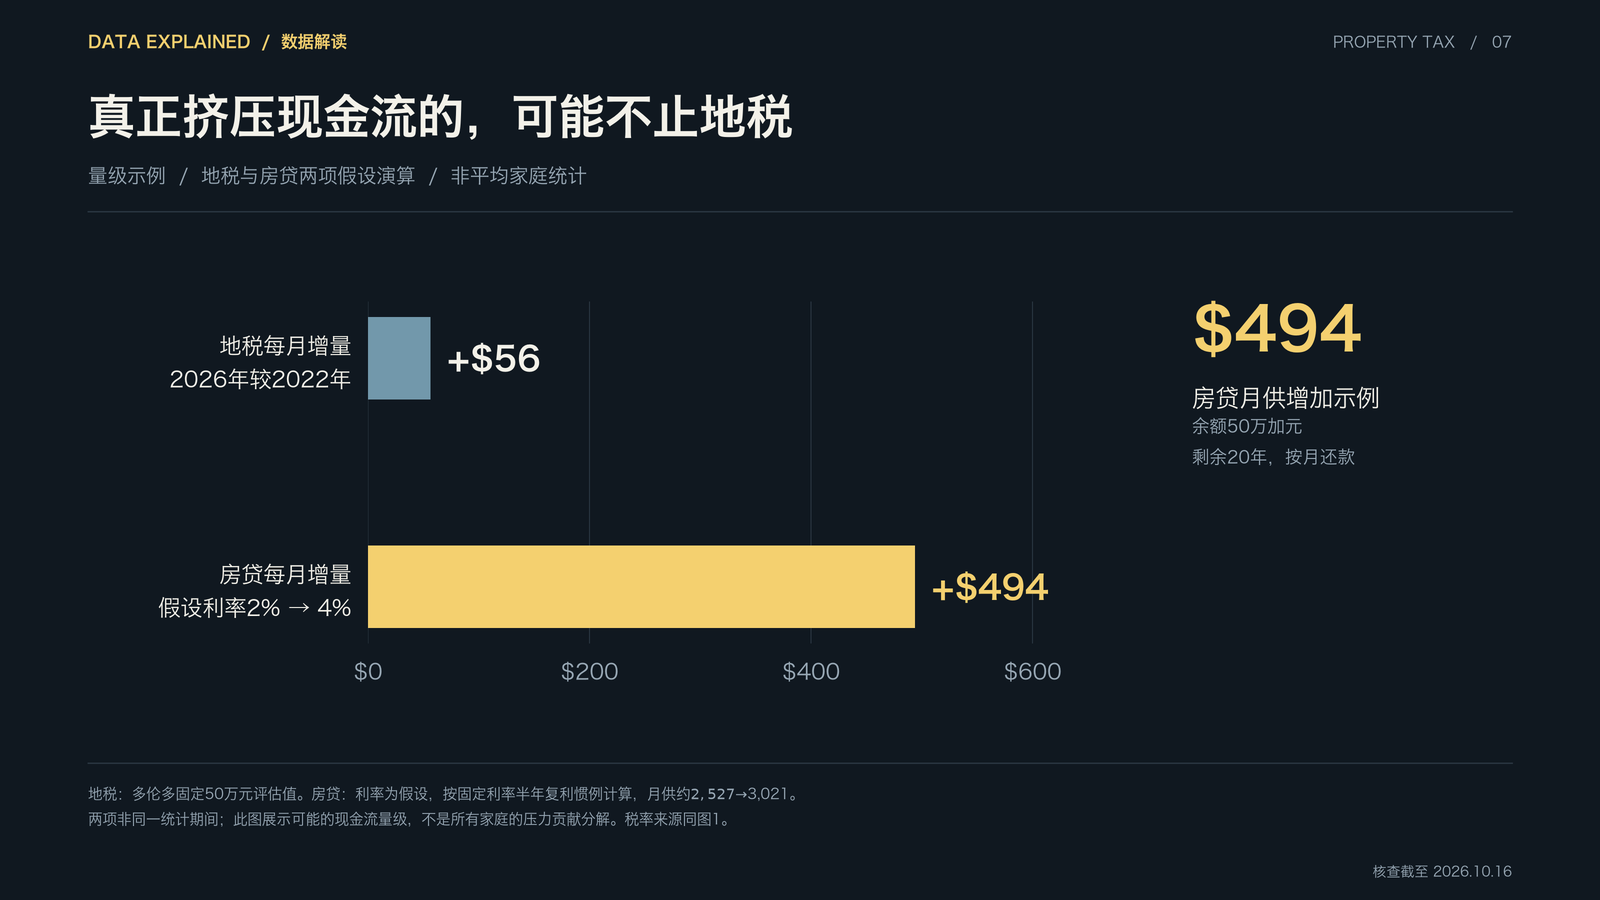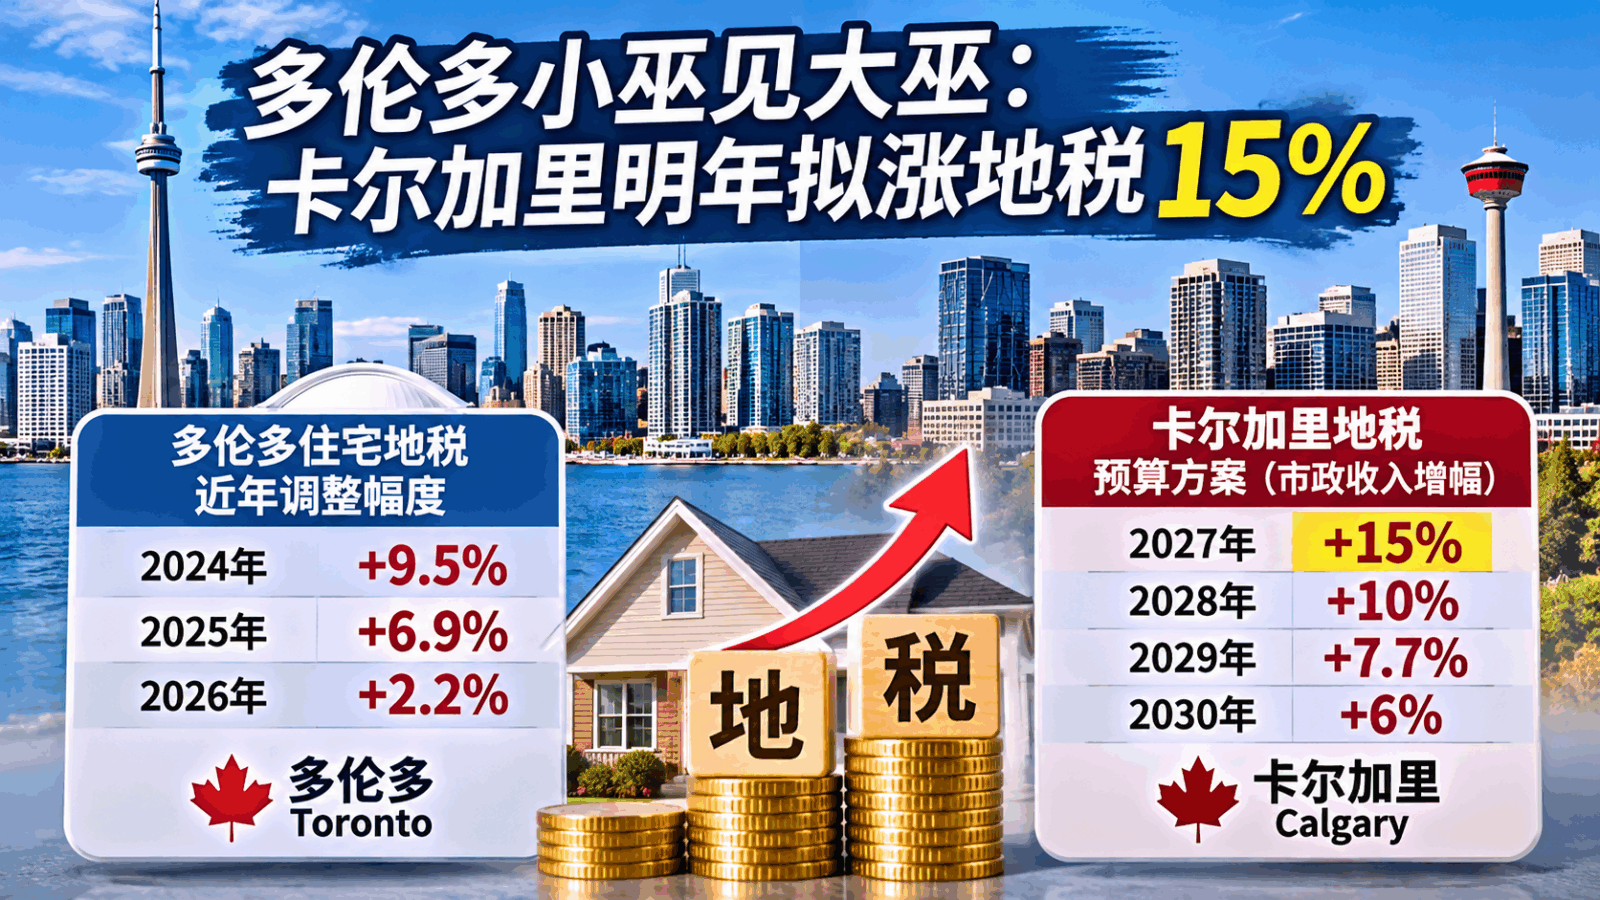
Mississauga and Brampton experienced steeper property tax increases over the same period, while US and English jurisdictions saw similar spikes. Official fiscal records reveal that blaming the entirety of municipal tax hikes and household financial strains on Mayor Olivia Chow overlooks cross-jurisdictional municipal shortfalls, cumulative inflation, and the macro mortgage renewal shock.
CC.NEWS Toronto, October 26, 2026 (By Jack S. Sun) — News Analysis — (Data verification as of October 16, 2026. Note: 2026 Canadian municipal property tax calculations utilize published budgets and municipal tax rates; international data is presented for full available fiscal years. This report is based entirely on public records, financial audits, and verifiable budget documents without fictional citations.)
The sentiment among Toronto residents that the cost of living has become increasingly difficult to bear is indisputable. Surging municipal tax bills, heightened grocery checkout costs, increased monthly mortgage renewals, and employment uncertainties are collectively squeezing household balance sheets.
On social media and in political discourse, however, this collective anxiety is frequently reduced to a single oversimplified narrative: “the mayor is hiking taxes too aggressively.”
1. Contextualizing Toronto Across the Greater Toronto Area
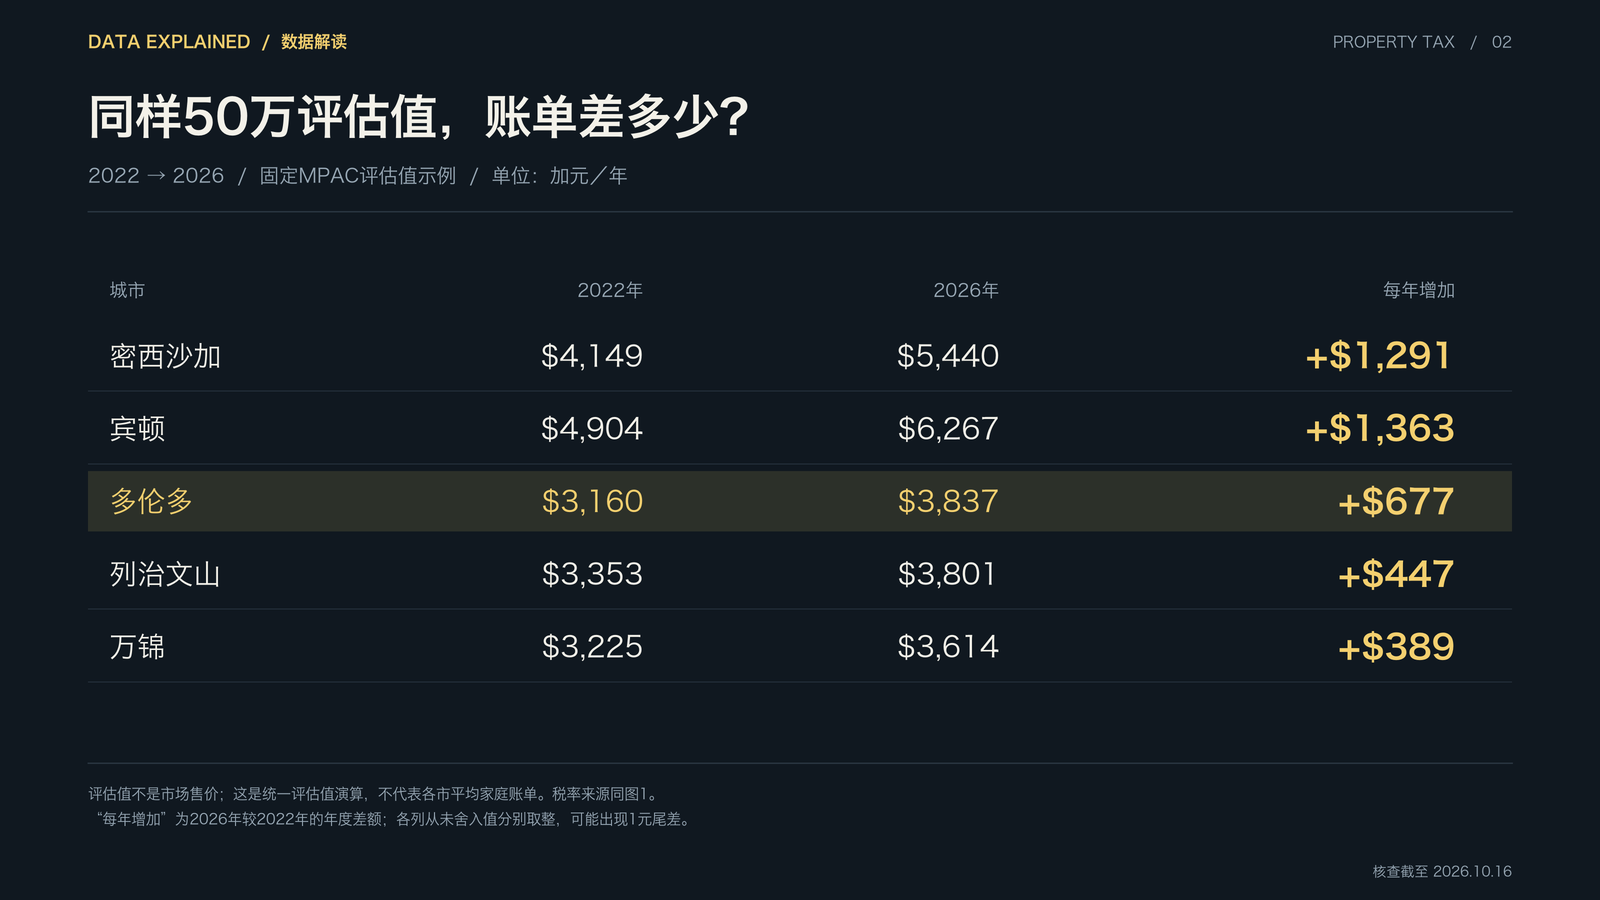
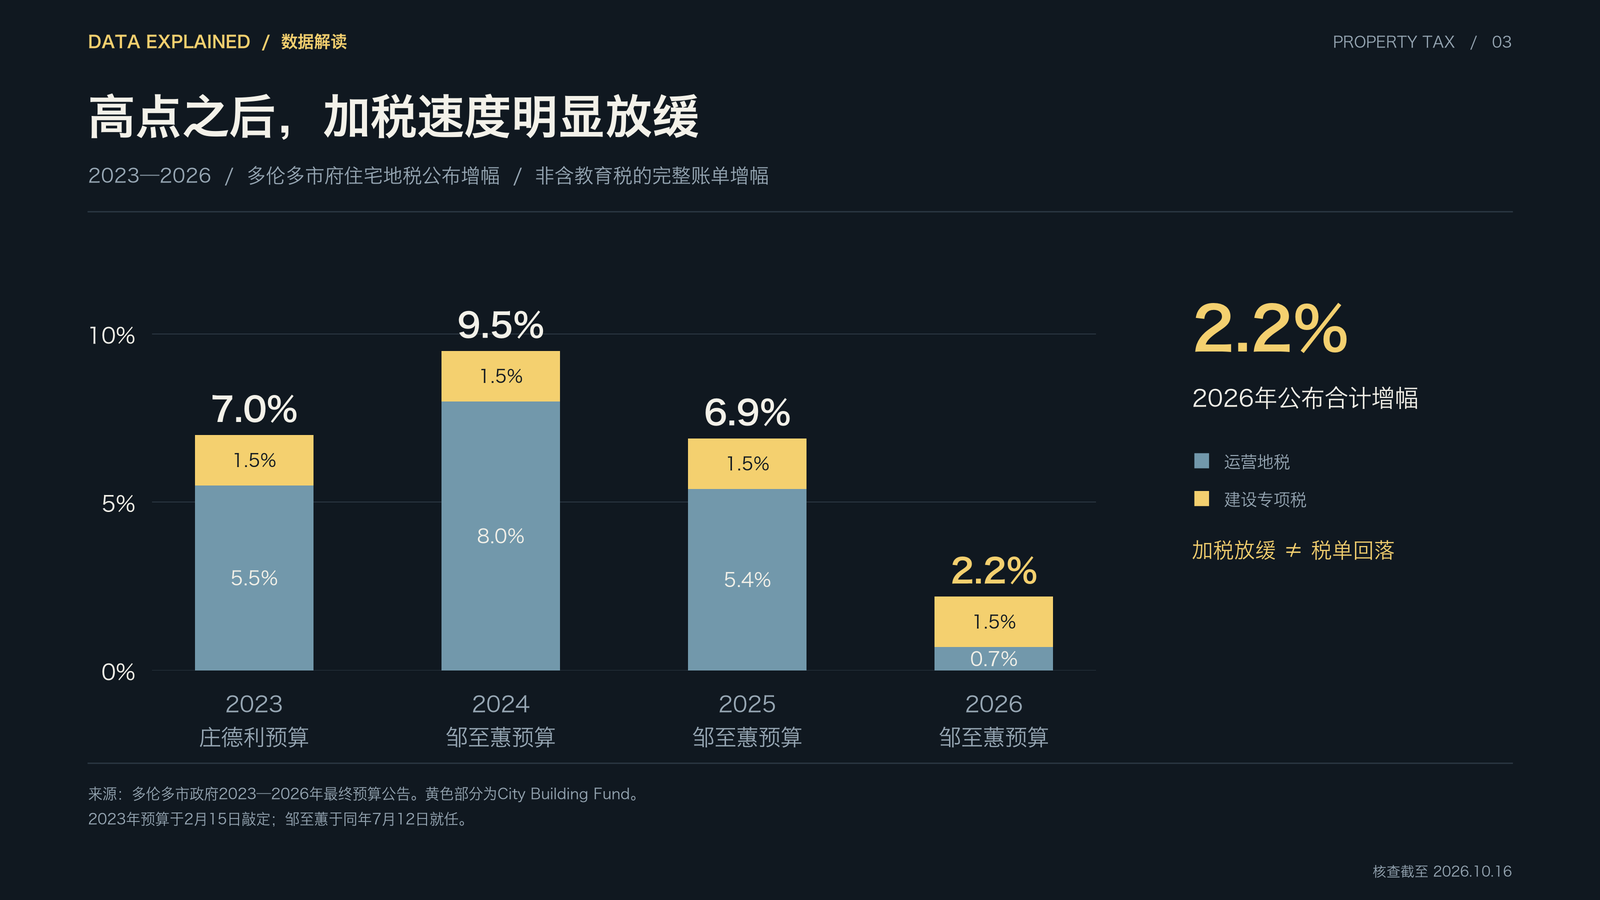
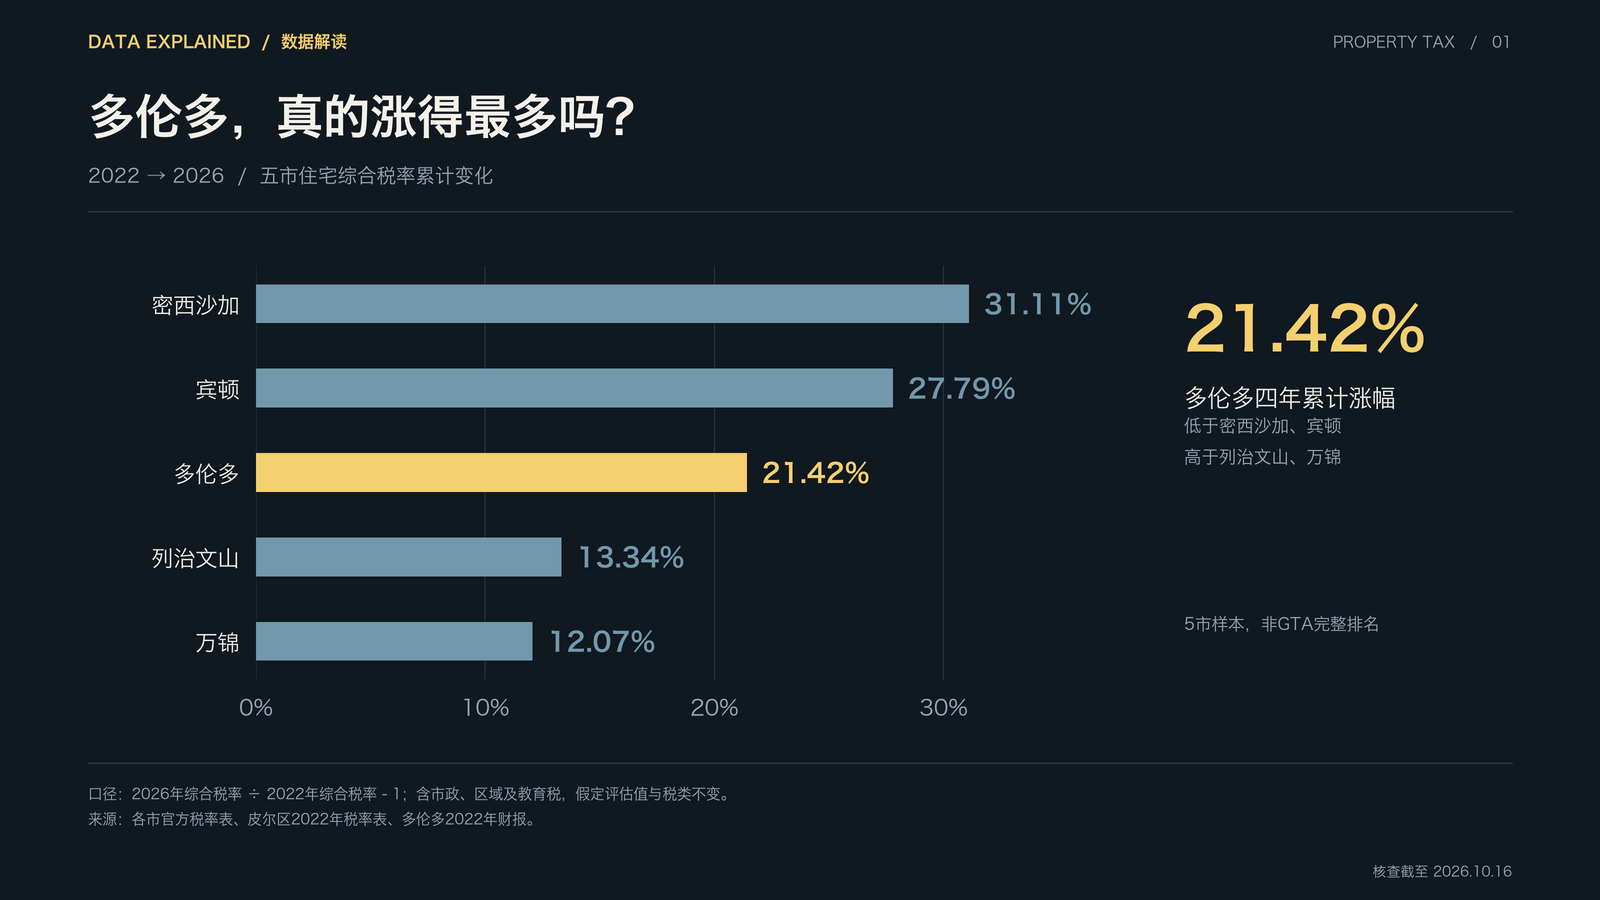
Placing Toronto’s tax trajectory within the broader GTA and international landscape reveals a much more nuanced reality. Based on official composite residential property tax rates from 2022 to 2026:
- Toronto: Increased approximately 21.42% cumulatively over four years;
- Mississauga: Increased approximately 31.11%;
- Brampton: Increased approximately 27.79%;
- Richmond Hill: Increased approximately 13.34%;
- Markham: Increased approximately 12.07%.
Toronto sits squarely in the middle tier of regional municipal tax trajectories. These figures directly rebut the claim that significant property tax adjustments are unique to Toronto or solely attributable to the current mayor, while simultaneously illustrating that municipalities across Ontario have struggled with post-pandemic operating deficits, inflation in construction inputs, and rising infrastructure renewal burdens.
2. Structural Causes of Municipal Fiscal Squeeze
Unlike federal and provincial governments, Canadian municipalities are legally prohibited from running operating deficits under the City of Toronto Act and Municipal Act. In addition, Toronto was left with a structural operating shortfall exceeding $1.5 billion following the pandemic, exacerbated by declining municipal land transfer tax revenues, increased transit operating subsidies, and frozen provincial funding formulas.
The landmark ‘New Deal for Toronto’ negotiated between Mayor Chow and Ontario Premier Doug Ford successfully uploaded the maintenance costs of the Gardiner Expressway and Don Valley Parkway to the province, unlocking billions in long-term capital relief. Nonetheless, base operating costs for emergency services, transit upkeep, and public works remain substantial cost drivers.
3. International Comparisons: London and U.S. Metros
A comparative look at peer English-speaking jurisdictions shows identical fiscal pressures:
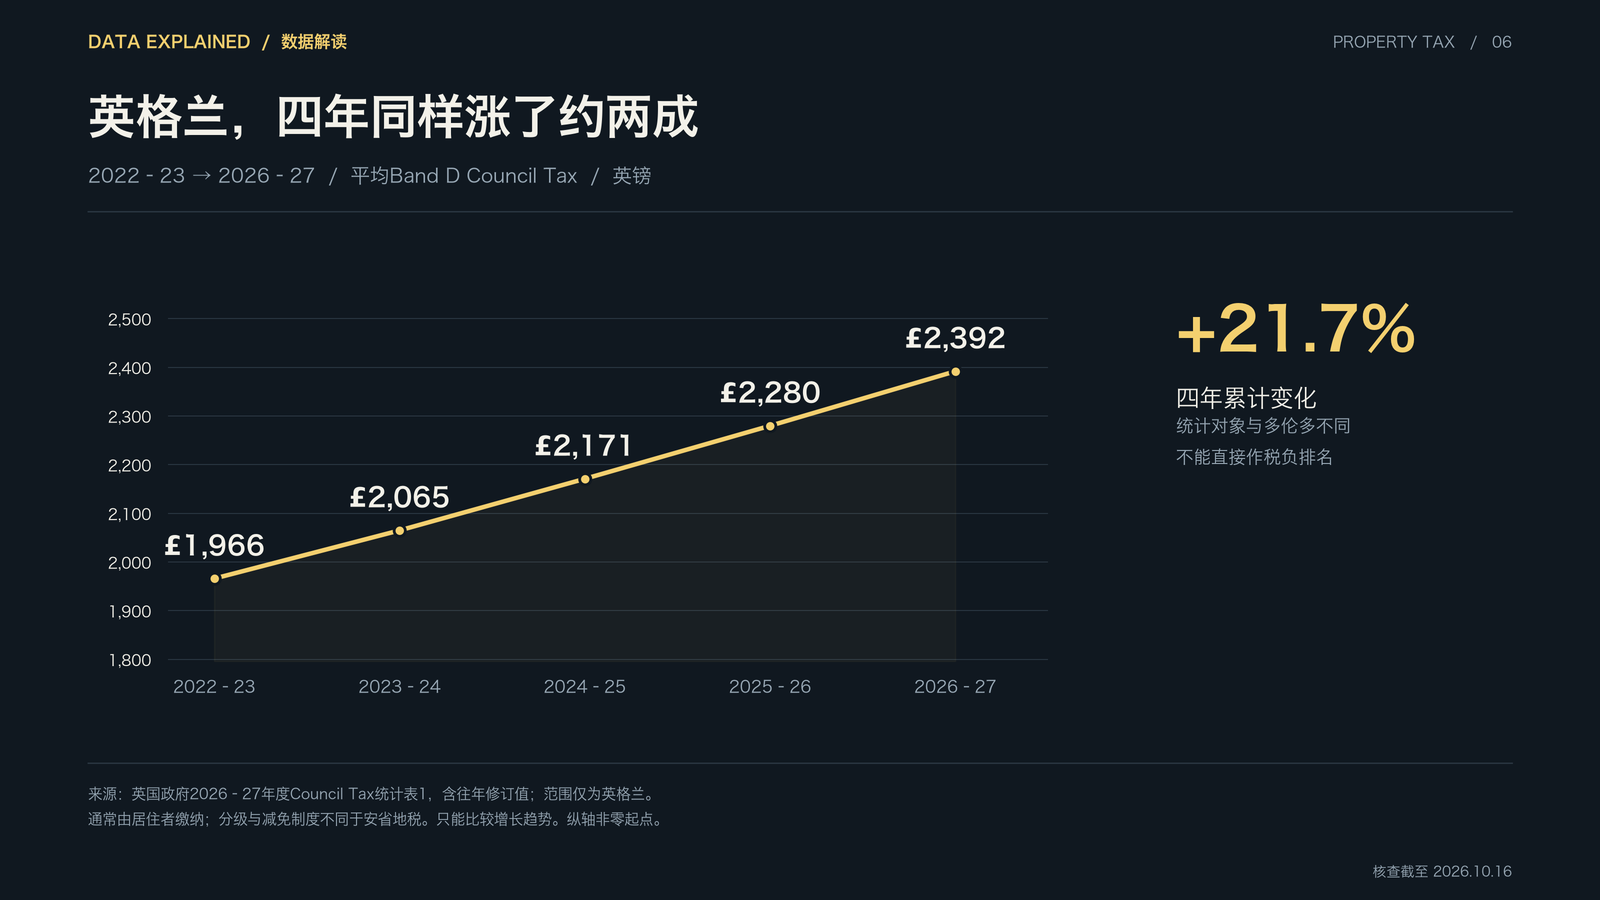
- United Kingdom: Across England, average Council Tax (Band D) rose by 5.1% in 2024/25 alone, with cumulative four-year increases exceeding 18% as local councils faced soaring social care burdens;
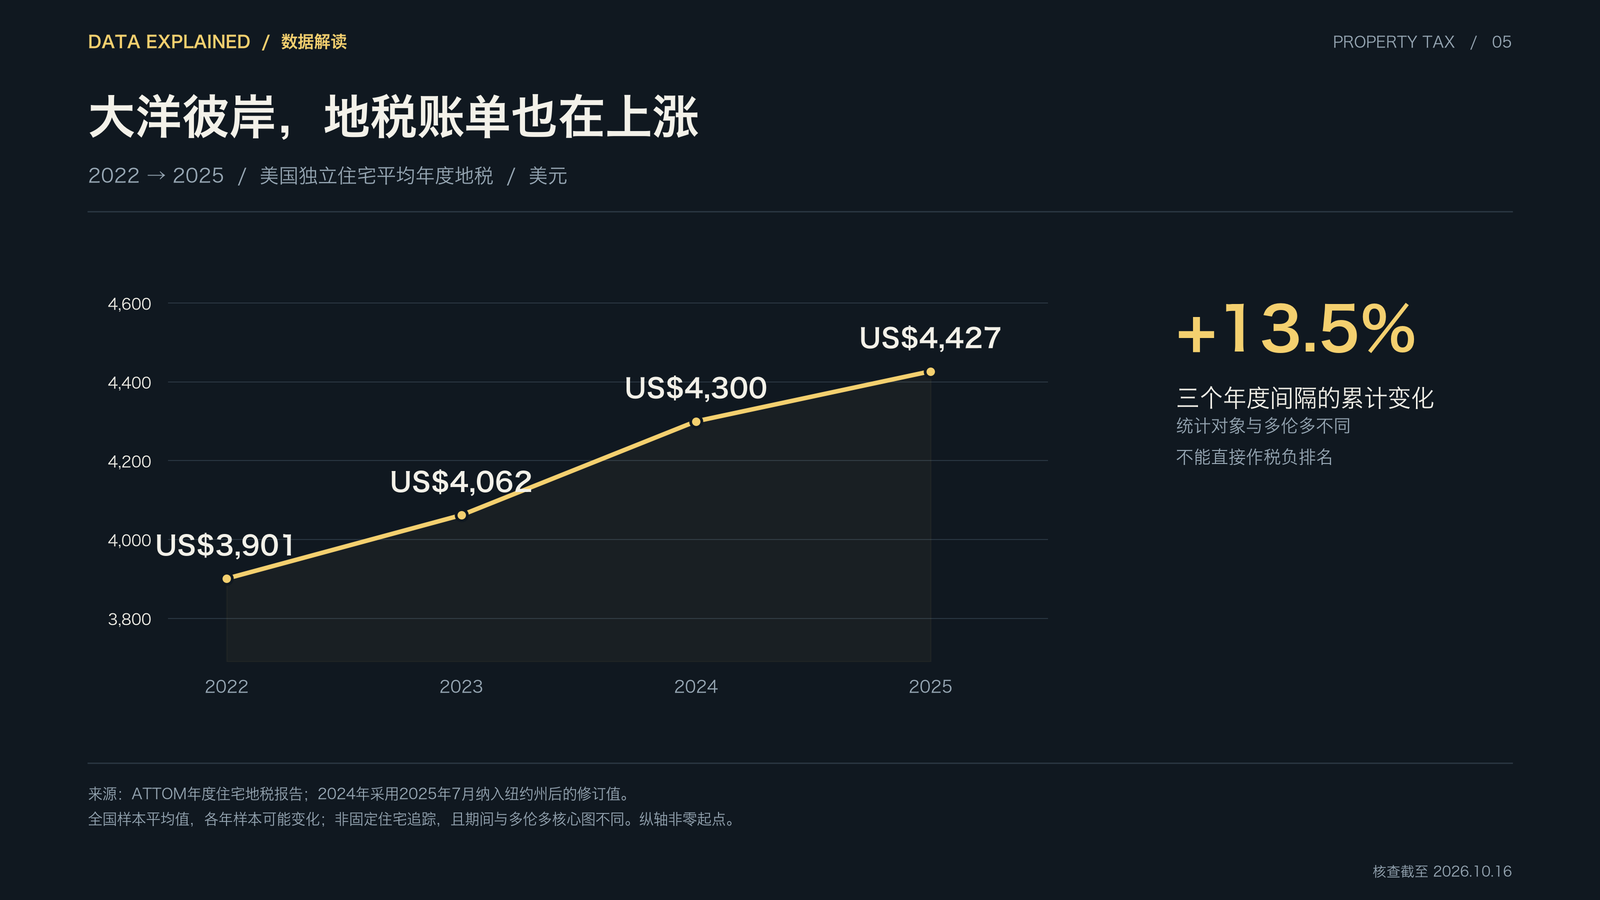
- United States: In metropolitan centers such as Chicago, Philadelphia, and New York, reassessments and school district levies pushed annual property tax burdens up by 15% to 25% over the same four-year window.
The data demonstrates that municipal cost inflation is a systemic macroeconomic phenomenon driven by interest rate shocks and infrastructure backlogs rather than isolated local policy choices.
Charts and Comparative Data